Model Anatomy · Episode 14 · 2:01
Why Polars is so fast: it reads only what the query needs
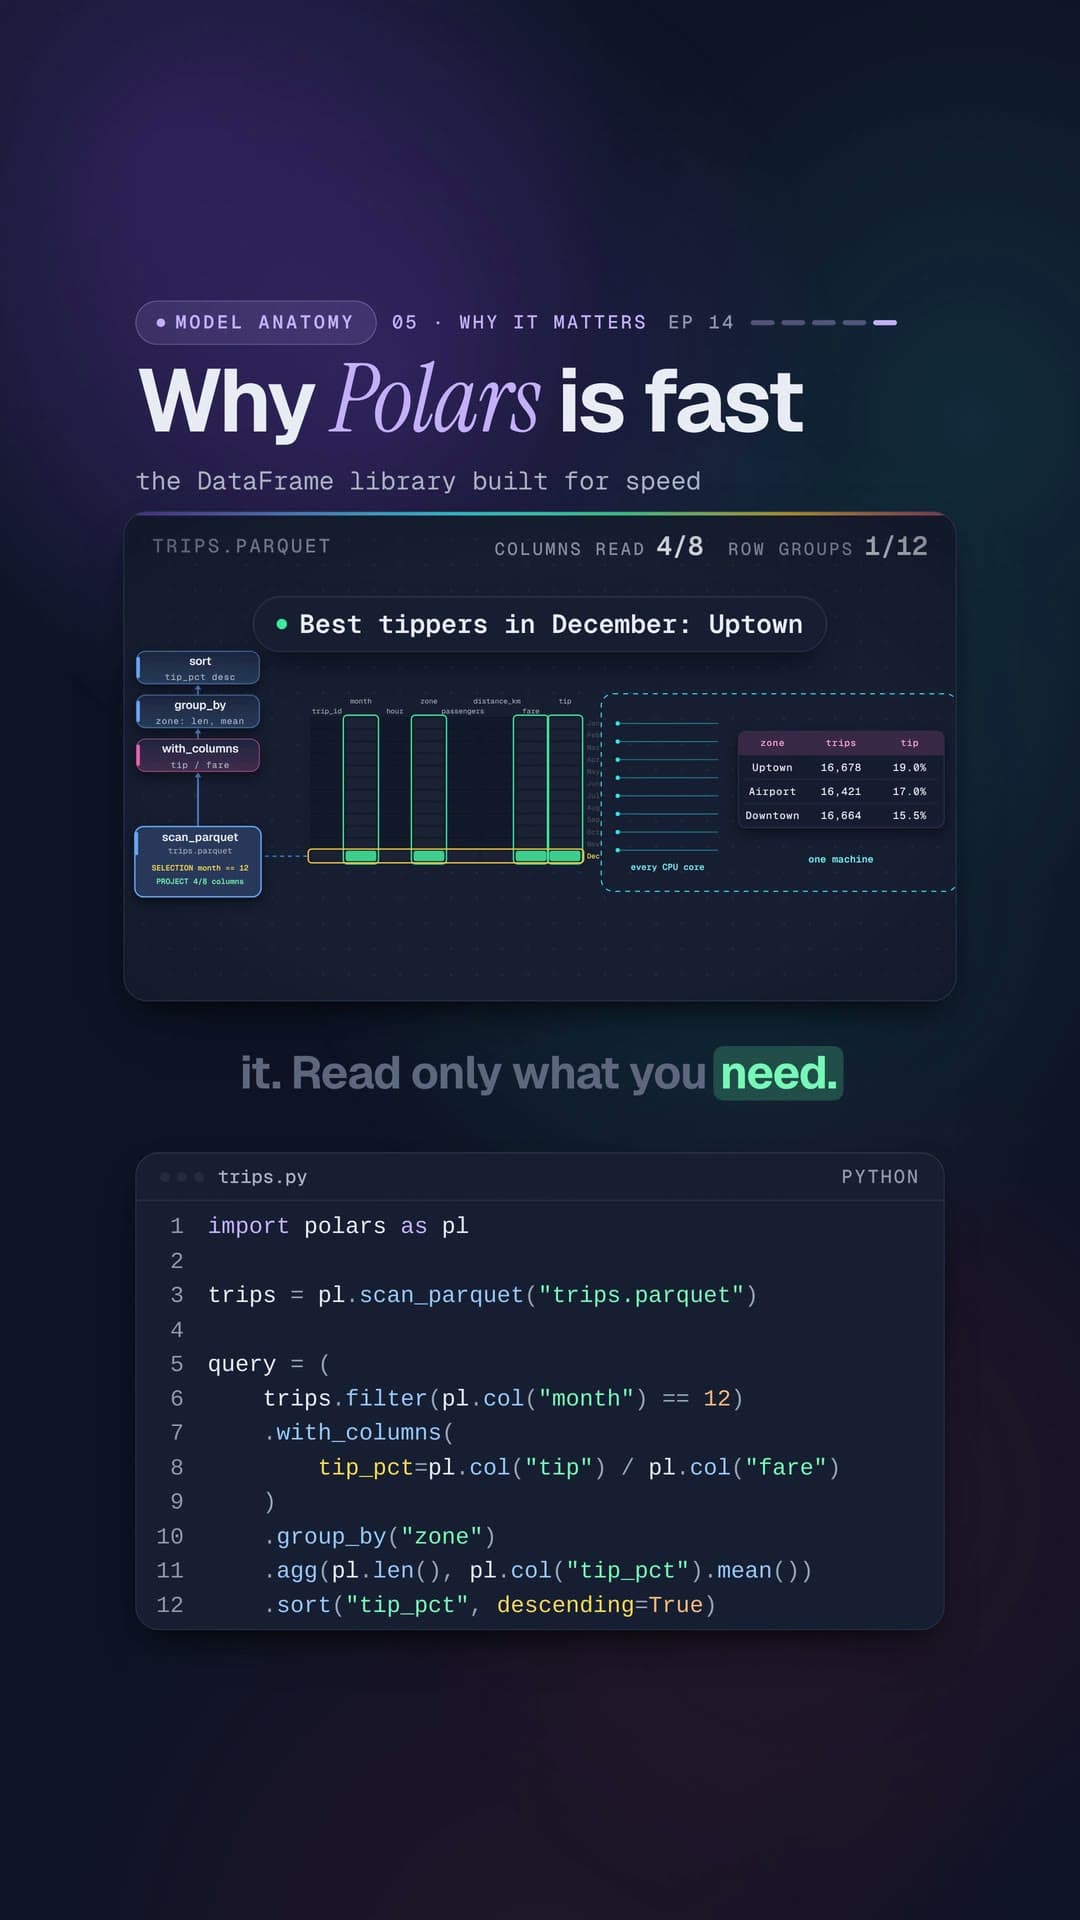
On 1.2 million taxi trips in Parquet, the query reads 4 of 8 columns and 1 of 12 row groups, thanks to projection and predicate pushdown. The answer: Uptown tips best, at 19%.
What you’ll needPython 3.10+, Polars
What you’ll need
- python.org/downloads →
 Python 3.10 or newerRuns the code. Check yours with
 python3 --version. - code.visualstudio.com →

 VS Code or CursorEither works; so does any editor you like.
 - git-scm.com/downloads →
 gitGets the code from GitHub.
  Polars 1.0+Fast DataFrames with a lazy query planner
pip install "polars>=1.0"
Set it up
- 1Get the code
git clone https://github.com/DayanEbrar0X/data-anatomy.ai.git
cd data-anatomy.ai
- 2Make a virtual environmentIt keeps this project's packages separate from the rest of your computer.
python3 -m venv .venv
source .venv/bin/activate
- 3Install the packagesrequirements.txt installs every lesson's packages. This one needs only: Polars.
pip install -r requirements.txt
# or just this lesson:
pip install "polars>=1.0"
- 4Run it
cd data-engineering/14-polars
python3 scripts/make_trips.py
cd src
python3 trips.py
Project structure14-polars/
Project structure
data-engineering/14-polars/Open on GitHub →
- scripts/
- make_trips.pymainwrites src/trips.parquet: 1.2M seeded trips, 8 columns, one row group per month
- src/
- trips.pyrunthe code from the video
- README.mdthe idea, how to run it, a line-by-line walkthrough, things to try
data-engineering/14-polars/src/trips.pyOpen on GitHub →
import polars as pl

trips = pl.scan_parquet("trips.parquet")

query = (
    trips.filter(pl.col("month") == 12)
    .with_columns(
        tip_pct=pl.col("tip") / pl.col("fare")
    )
    .group_by("zone")
    .agg(pl.len(), pl.col("tip_pct").mean())
    .sort("tip_pct", descending=True)
)

for line in query.explain().splitlines()[-3:-1]:
    print(line.strip())

df = query.collect()
for zone, n, tip in df.head(3).iter_rows():
    print(f"{zone:<9} {n:,} trips  {tip:.1%} tip")
print("Best tippers in December:", df["zone"][0])
Transcript
Same question, same data. One library reads the whole file. The other reads only what it needs. That's Polars.
A DataFrame library written in Rust, using every core you have. Data lives in columns, in the Apache Arrow format. Our question: in December, which zone tips best? 1.
2 million taxi trips. 8 columns. One row group per month. scan_parquet doesn't read a row.
It starts a lazy plan. Keep only December trips. pl.col is an expression.
It describes the work, not the data. Add a column: the tip as a share of the fare. Group by zone, count the trips, average the tip, and sort the best first. Nothing has run yet.
We've only described a plan. explain() prints the plan after the optimizer rewrites it. Watch the filter. It moves down, into the scan.
That's predicate pushdown: rows are filtered while the file is read. Same for columns. Only the four this query touches get read. That's projection pushdown.
collect() finally runs it, on every core at once. Then we print the top three zones, and the winner. Let's run it. The plan proves it: four of eight columns read, and the December filter sits inside the scan.
Each row group stores min and max, so 11 months get skipped. Uptown tips best, at 19 percent. Airport and Downtown follow. Same answer as reading everything, with a fraction of the work.
That's why teams use Polars for pipelines and ML feature prep, on one machine, long before they need a cluster. One catch: read_parquet loads the whole file, right away. Start lazy: scan_parquet, scan_csv, or .lazy().
Describe the work. Let the plan shrink it. Read only what you need.
Read the lesson on GitHub →- #polars
- #python
- #dataengineering
- #parquet