Model Anatomy · Episode 14 · 30-second cut · 0:41
Why Polars is fast: it skips work
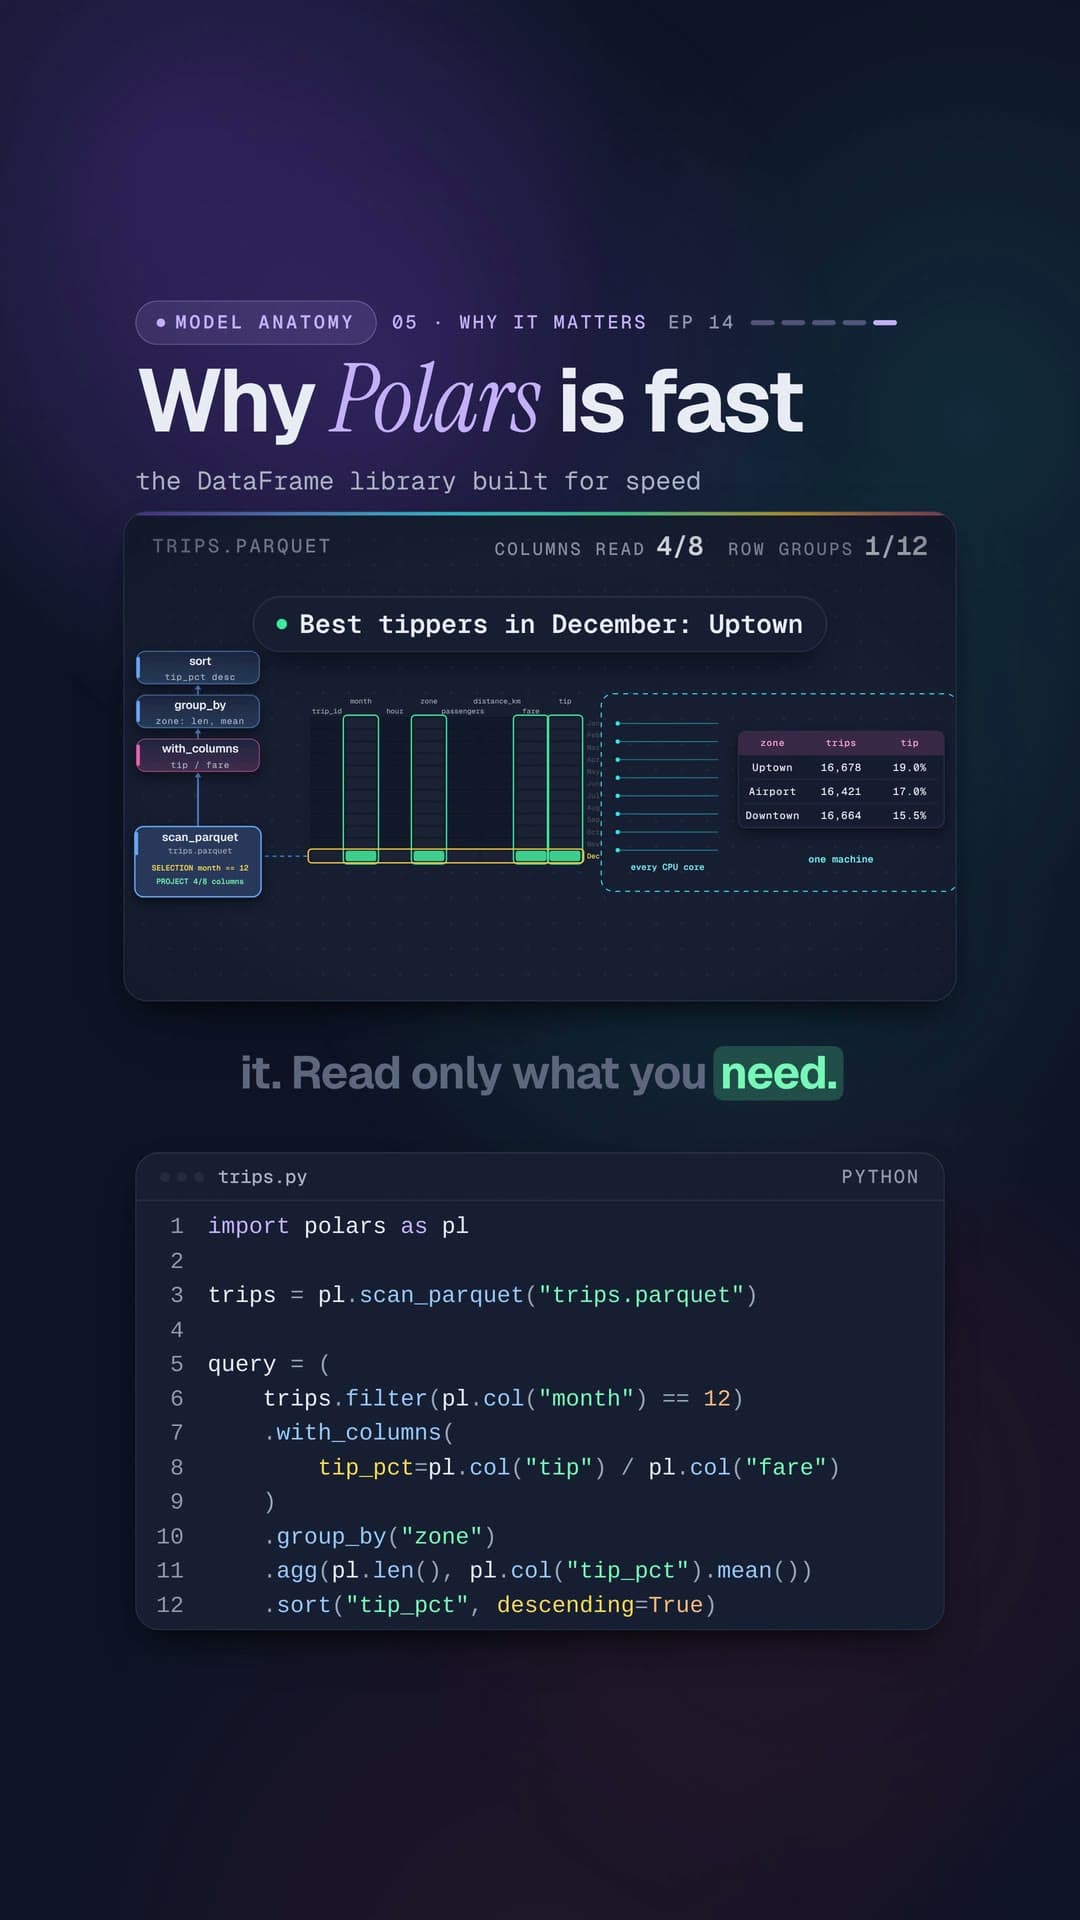
Same 1.2 million taxi trips, but Polars reads 4 of 8 columns and skips 11 of 12 months. Same answer either way: Uptown tips best, at 19.0%.
Key moments
What you’ll needPython 3.10+, Polars
What you’ll need
- python.org/downloads →
 Python 3.10 or newerRuns the code. Check yours with
 python3 --version. - code.visualstudio.com →

 VS Code or CursorEither works; so does any editor you like.
 - git-scm.com/downloads →
 gitGets the code from GitHub.
  Polars 1.0+Fast DataFrames with a lazy query planner
pip install "polars>=1.0"
Set it up
- 1Get the code
git clone https://github.com/DayanEbrar0X/data-anatomy.ai.git
cd data-anatomy.ai
- 2Make a virtual environmentIt keeps this project's packages separate from the rest of your computer.
python3 -m venv .venv
source .venv/bin/activate
- 3Install the packagesrequirements.txt installs every lesson's packages. This one needs only: Polars.
pip install -r requirements.txt
# or just this lesson:
pip install "polars>=1.0"
- 4Run it
cd data-engineering/14-polars
python3 scripts/make_trips.py
cd src
python3 trips.py
Project structure14-polars/
Project structure
data-engineering/14-polars/Open on GitHub →
- scripts/
- make_trips.pymainwrites src/trips.parquet: 1.2M seeded trips, 8 columns, one row group per month
- src/
- trips.pyrunthe code from the video
- README.mdthe idea, how to run it, a line-by-line walkthrough, things to try
trips.pyOpen on GitHub →
import polars as pl
tip = pl.col("tip") / pl.col("fare")
q = (pl.scan_parquet("trips.parquet")
     .filter(pl.col("month") == 12)
     .group_by("zone").agg(tip.mean()))
for line in q.explain().splitlines()[-3:-1]:
    print(line.strip())
zone, share = q.collect().sort("tip").row(-1)
print(f"Top tippers: {zone}, {share:.1%}")
Transcript
Same question, same file. One library reads all of it. Polars reads only what it needs. The tip share is just an expression.
scan_parquet reads nothing yet. It starts a plan. Keep December, then average the tip by zone. explain() prints the optimized plan.
collect() runs it, and we print the winner. Run it. Projection pushdown: four of eight columns read. Predicate pushdown: 11 of 12 months never get read.
Top tippers: Uptown, at 19 percent. Same answer, a fraction of the work. Read only what you need.
Read the lesson on GitHub →- #polars
- #python
- #dataengineering
- #pandas